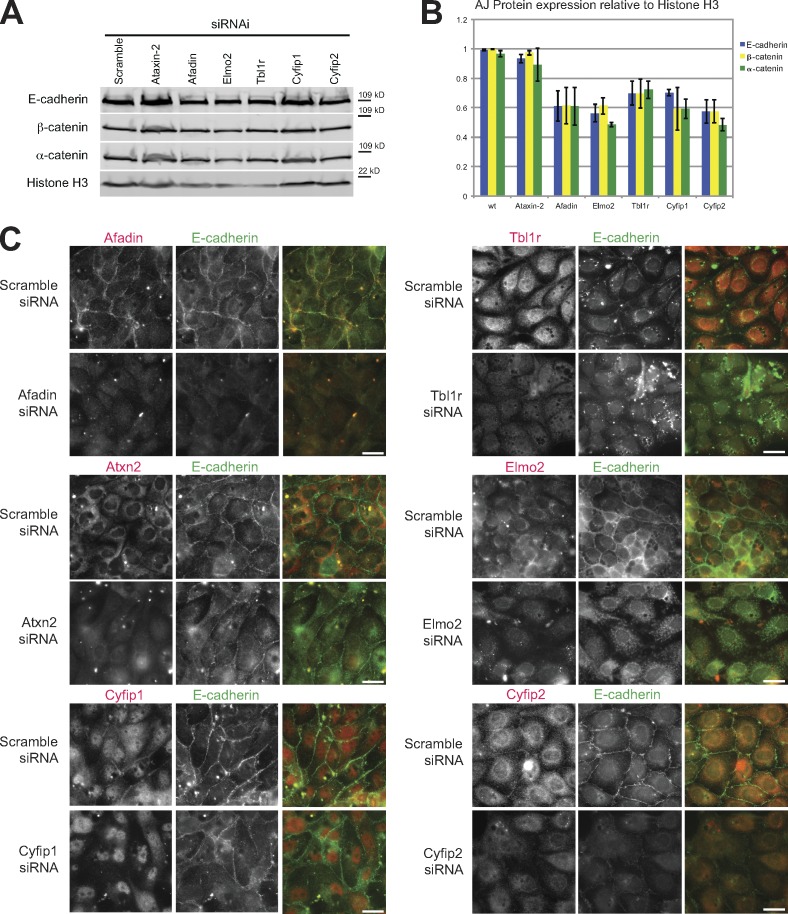
Figure 7.
Cadherin–catenin effects in siRNA-treated MDCK cells. (A) Western blots for the indicated siRNA-treated cells. Hashes indicate molecular mass standards. (B) Quantification of three Western blots showing percent expression of the indicated proteins relative to histone H3. wt, wild type. Error bars show SEMs for three independent experiments. (C) Immunofluorescence for the indicated siRNA-treated cells. Bars, 25 µm.

