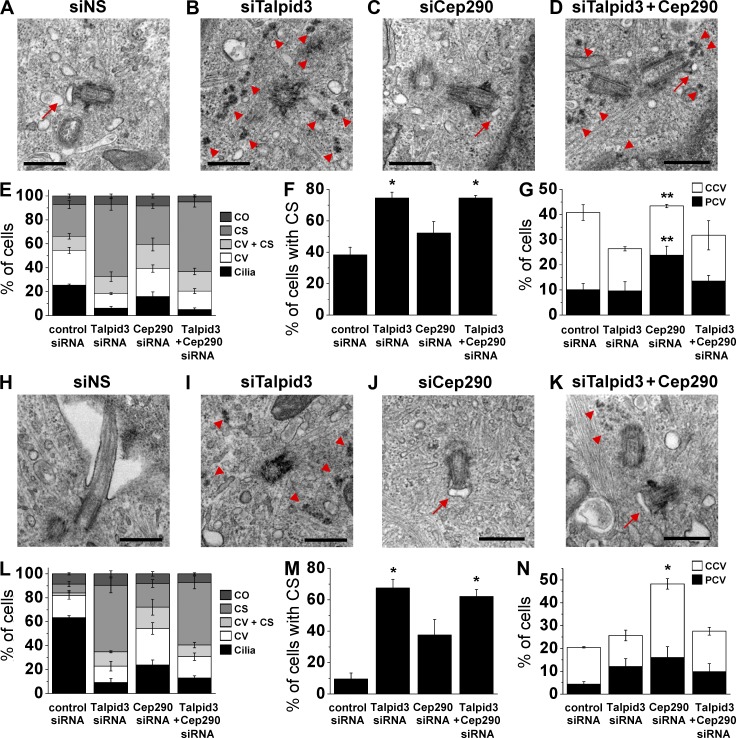
Figure 7.
Ablation of Talpid3 or Cep290 suppresses cilia formation via distinct processes. (A–D, H–K) RPE1 cells transiently transfected with siRNA against control (siNS; A and H), Talpid3 (B and I), Cep290 (C and J), or Talpid3 and Cep290 (D and K) were serum starved for 6 h (A–D) or 24 h (H–K) and processed for TEM. Red arrows indicate ciliary vesicles and red arrowheads indicate centriolar satellites. Bars, 500 nm. (E and L) Each siRNA treated population was quantified at 6 h (E) or 24 h (L) of serum starvation with the percentages of cells that were ciliated (Cilia), contained ciliary vesicles (CV), contained ciliary vesicles and centriolar satellites (CV + CS), or centriolar satellites (CS). Centrosomes without CV and/or CS were labeled as centrosomes only (CO). (F and M) Percentages of cells with CS and CV + CS are quantified for each siRNA-treated sample at 6 h (F) or 24 h (M) of serum starvation. (G and N) Percentages of cells with CV and CV + CS are quantified at 6 h (G) or 24 h (N) of serum starvation according to the frequency of populations containing primary ciliary vesicles (PCV) or capped ciliary vesicles (CCV). (E–G and L–N) Average of three independent experiments is shown. Error bars indicate SEM. *, P < 0.01; **, P < 0.05 compared with control siRNA.

