
Fig. 8.
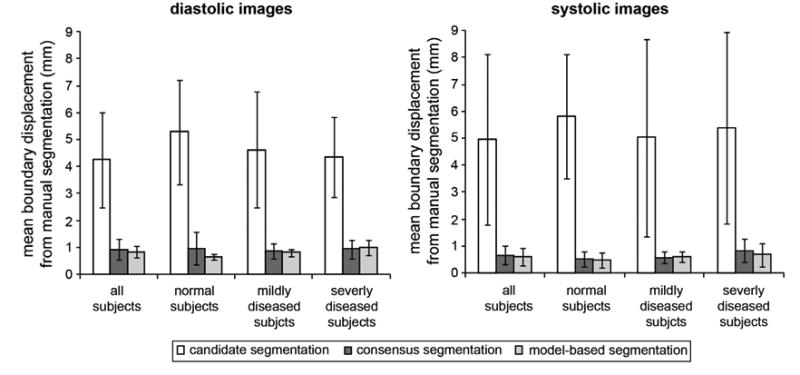
Segmentation results at diastole (left) and systole (right). The bar graphs show the mean boundary displacement between the manual segmentation and each of the following: the candidate segmentations obtained by single-atlas registration, the consensus segmentation generated by joint label fusion, and the model-based segmentation created with the deformable cm-rep. The results are broken down by disease category: all subjects, subjects with normal mitral valve function, mildly diseased subjects, and subjects with severe mitral regurgitation.