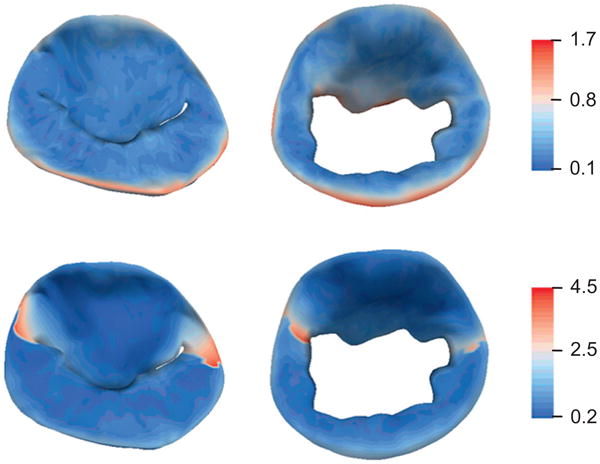
Fig. 9.

Color maps showing localized mean distance between the automatic and manual segmentations in millimeters. The results are shown for the leaflets at systole (left column) and diastole (right column). Segmentation accuracy is evaluated in terms of a single-label model (top row) and multi-label model (bottom row), in which the anterior and posterior leaflet segmentations are evaluated independently. (For interpretation of the references to color in this figure legend, the reader is referred to the web version of this article.)
