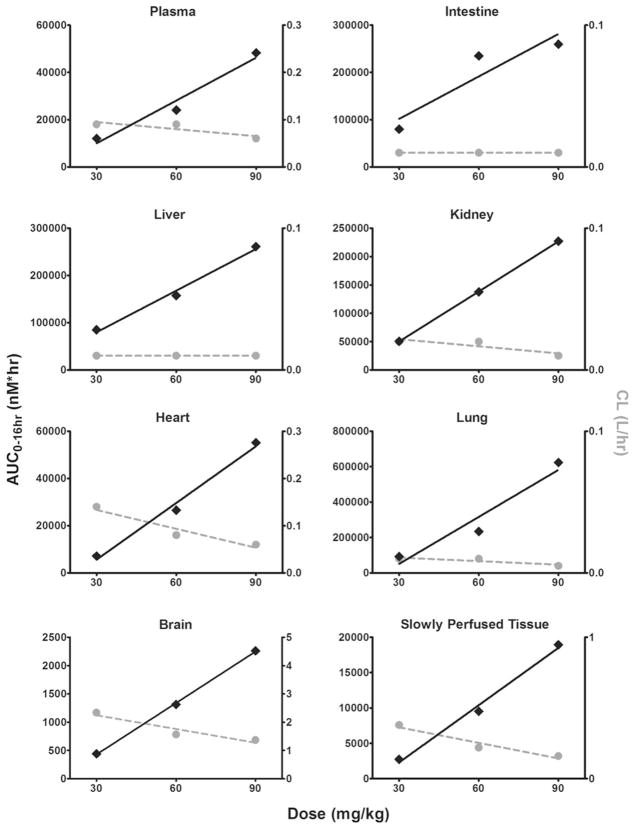
Fig. 3.
Area under the concentration–time curve calculated from 0 to 16 h (AUC0–16 h) and clearance (CL) for the mouse 30, 60 and 90 mg/kg dose cohorts in plasma, intestine, liver, kidney, heart, lung, brain and slowly perfused tissue. AUC0–16 h is presented on the left y axis and is represented by the solid black diamonds, with the corresponding linear regression trendline shown as the solid black line. CL is presented on the right y axis and is represented by the solid gray circles with the corresponding linear regression trendline shown as the dashed gray line. Both AUC0–16 h and CL were determined by noncompartmental analysis

