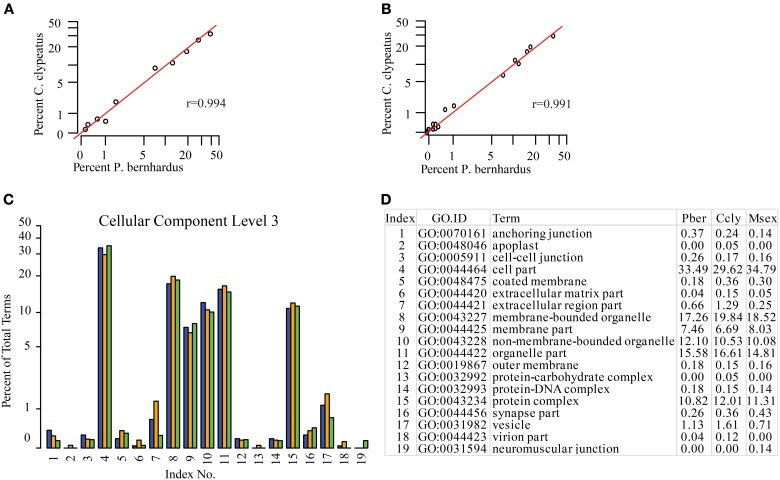
Figure 2.
Distribution of GO terms in the category Cellular Component. (A) Cellular Component level 2, (B) Cellular Component level 3. Red line: predicted linear slope. r = Pearson coefficient, (C) Barplot Cellular Component level 3, all terms; blue: Pber, orange: Ccly, green: Msex; (D) chart index table.

