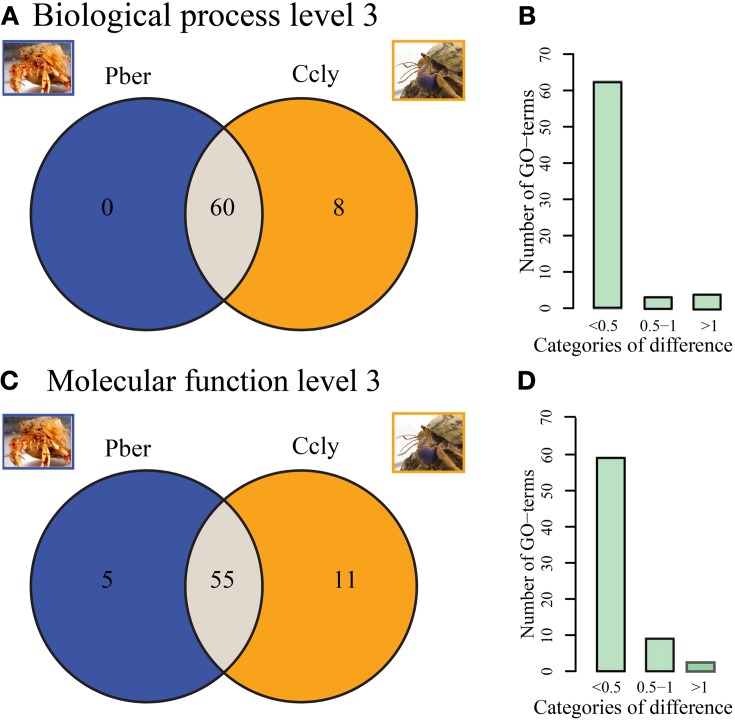
Figure 3.
(A,B) Biological Process. (A) Distribution of assigned terms in the category of “Biological Process” between Pber and Ccly, 60 terms shared between Pber and Ccly, 8 terms unique to Ccly. (B) Distribution of term ratios compared between in the categories “<0.5% difference,” “0.5–1% difference,” and “>1% difference.” (C,D) Molecular function (C) Distribution of terms between Pber and Ccly, 55 terms shared, 5 terms unique to Pber, 11 terms unique to Ccly. (D) Distribution of term ratios in the categories “<0.5% difference,” “0.5–1% difference,” and “>1% difference.” Percentage difference has been calculated as described in Bioinformatics.

