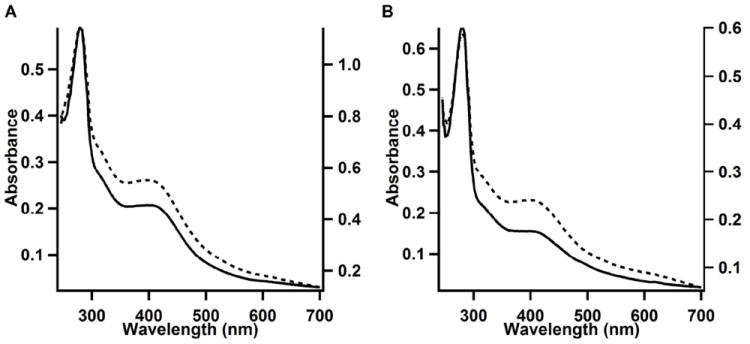
Figure 2.

UV-visible spectra of A) AI WT anSMEcpe (5 μM, solid line, left Y-axis) and RC WT anSMEcpe (10 μM, dotted line, right Y-axis). The A279/A387 ratios of AI and RCN proteins were 2.8 and 2.1, respectively. B) UV-visible spectra of AI anSMEcpeC15A/C19A/C22A (9.4 μM, solid line, left Y-axis) and RCN anSMEcpeC15A/C19A/C22A (5.6 μM, dashed line, right Y-axis). The A279/A387 ratios of AI and RCN proteins were 4.2 and 2.4, respectively.
