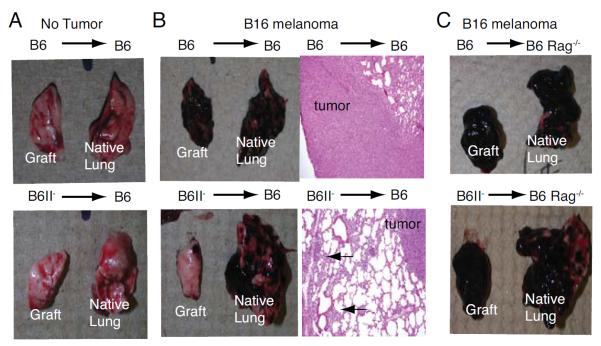
Figure 3.
Tumor immune response. Gross appearance and weights of B6 and B6II− grafts and native right lungs (A) without and (B) after injection of B16 melanoma. Hematoxylin and eosin staining of grafts indicating melanoma (labeled as tumor) and inflammatory infiltrates (arrows). (C) Gross appearance and weights of B6 and B6II− grafts four weeks after transplantation into B6 Rag−/− mice injected with B16 melanoma. (D) Absolute numbers of graft-infiltrating CD4+CD90+ T cells and percentage of graft-infiltrating CD4+ T cells expressing Foxp3 in B6 or B6II− grafts at same time points as shown in (B). (E) Absolute numbers of CD8+CD90+ T cells and CD8+ T cells with T cell receptor-specificity for tyrosinase-related protein 2 in B6 or B6II-grafts at same time points as described in (B). Figure summarizes sixteen and nineteen transplanted mice per group in B6 recipients of B6 and B6II− grafts, respectively and seven transplanted mice per group in B6 Rag−/− recipients.

