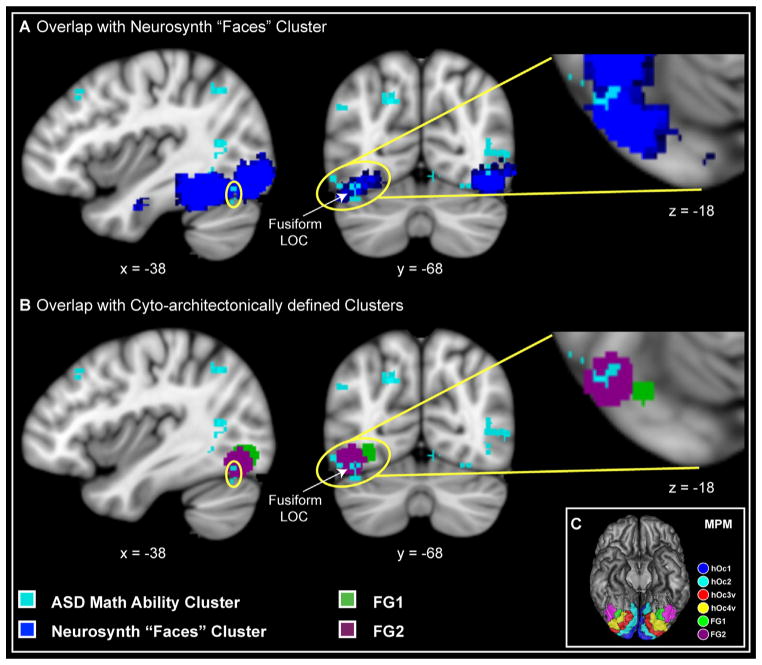
Figure 3.
Brain regions predicting numerical problem-solving abilities in children with autism spectrum disorder (ASD) overlap with face processing regions and cytoarchitectonically defined regional maps. Voxels in the left ventral temporal-occipital cortex, encompassing inferior lateral occipital cortex (LOC) and fusiform gyrus (shown in cyan), predicted better numerical abilities (R2 = .69, q = .04, Cohen’s f 2 effect size = 2.28) in children with ASD. (A) Voxels predicting better numerical abilities in ASD (cyan) showed prominent overlap with ventral temporal-occipital cortex face processing regions identified using Bayesian meta-analysis of 406 studies (blue) (www.neurosynth.org) (30). (B) Voxels predicting better numerical abilities in ASD (cyan) showed prominent overlap with cytoarchitectonically defined maps of the posterior fusiform gyrus, FG1 (green) and FG2 (violet) (31). (C) Maximum probability map (MPM) of the visual cortex. Other cytoarchitectonically delineated areas are abbreviated using the following nomenclature: hOc (human occipital cortex). Ordinal numbers 1 through 4 refer to the cytoarchitectonically defined visual areas moving laterally from the primary visual cortex (Brodmann area 17/primary visual cortex) (32). [Reproduced with permission from Caspers et al. (31)].

