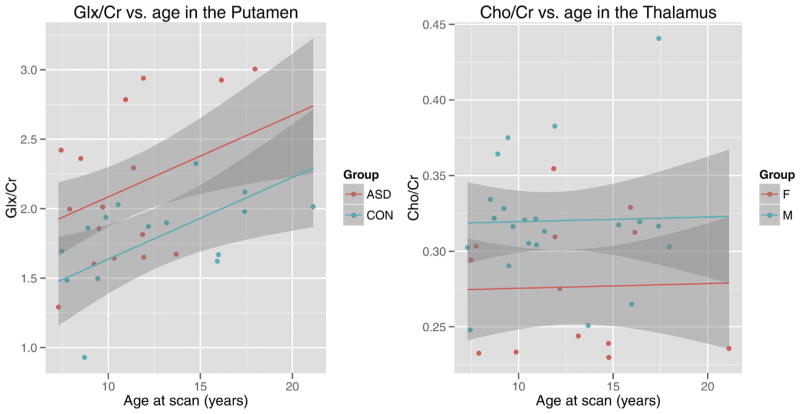
Fig. 2.
Age-related changes in metabolic concentrations in individuals with and without autism spectrum disorders. On the left: A scatter plot depicting glutamate (Glx/Cr) in the putamen for individuals with ASD and typically developing controls. On the right: a scatter plot depicting choline (Cho/Cr) in the thalamus for boys and girls. 95% confidence intervals are shown in the shaded regions. Abbreviations: ASD: autism spectrum disorders; CON: typically developing controls, F: female and M: male.

