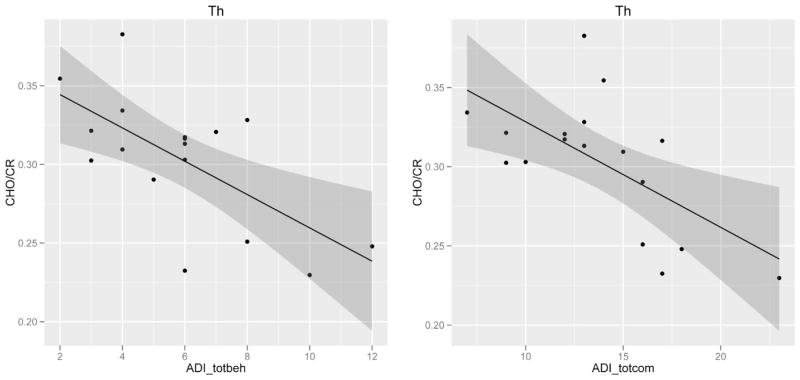
Fig. 3.
Example of correlation of metabolite ratios with core symptom domain severity. Scatter plots of choline (Cho/Cr) concentration in the thalamus against total behavior, compulsions, and stereotyped behaviors scores, and total communication scores from the autism diagnostic interview-revised, in individuals with autism spectrum disorders. 95% confidence intervals are shown in the shaded regions. Abbreviations: Th: thalamus, ADI_totbeh: autism diagnostic interview revised – total behavior, compulsions, and stereotyped behaviors score, and ADI_totcom: utism diagnostic interview revised – total communication scores.

