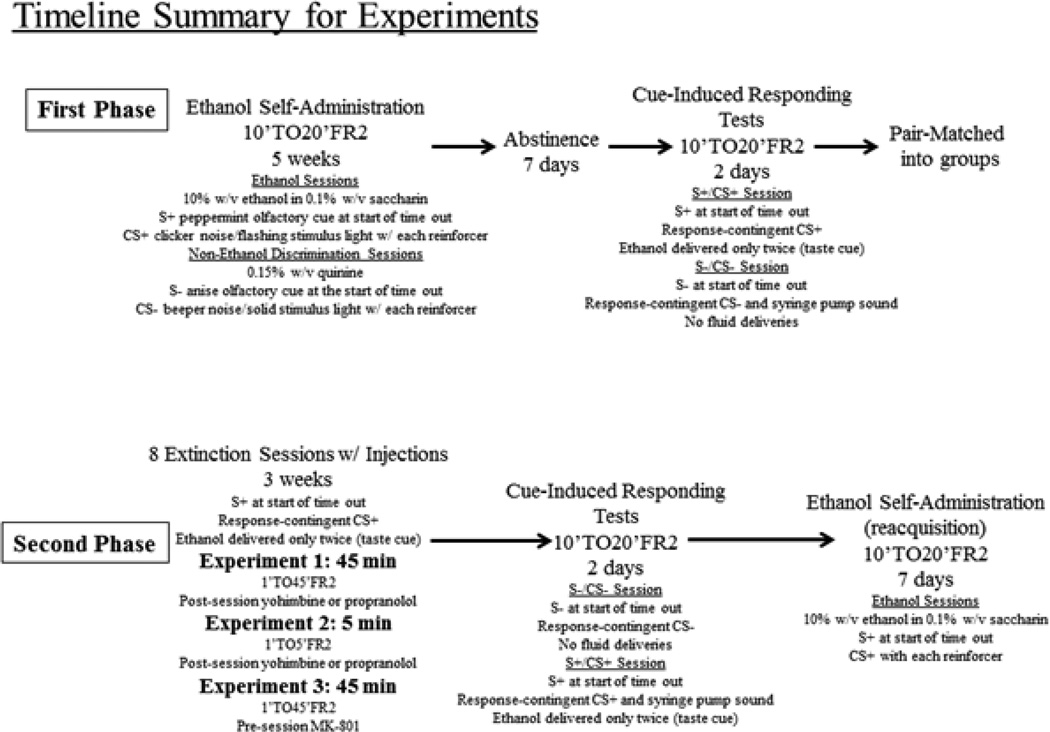
Fig. 1.
Diagrams illustrating the timeline of experimental manipulations during Experiment 1 and Experiment 2. The timeline for Experiment 3 was similar to experiment 1 with the exception of the order of cue-induced responding presentation and the drug treatment during the 8-session extinction period and an additional 2 days during the reacquisition period.

