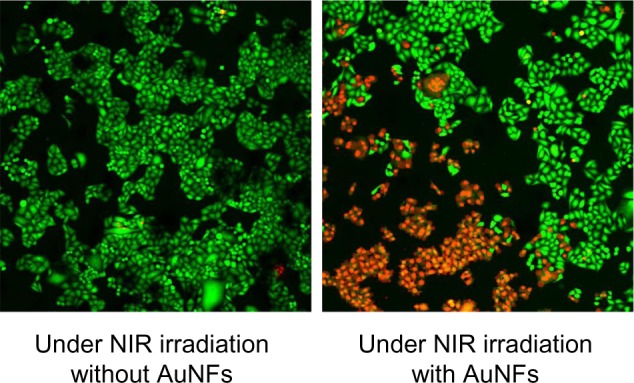
Figure 6.

Fluorescence microscopy images of HeLa cells under different treatment conditions and stained with calcein acetoxymethyl ester and propidium iodide. The green and red areas represent the regions of living and dead cells, respectively. Concentration of Au nanoflowers (AuNFs), 0.6 mg/mL; near-infrared (NIR) laser, λ=808 nm, 9 W/cm2, 5 minutes; image size 1.3 × 1.3 cm and under-irradiation area 0.4 cm2.
