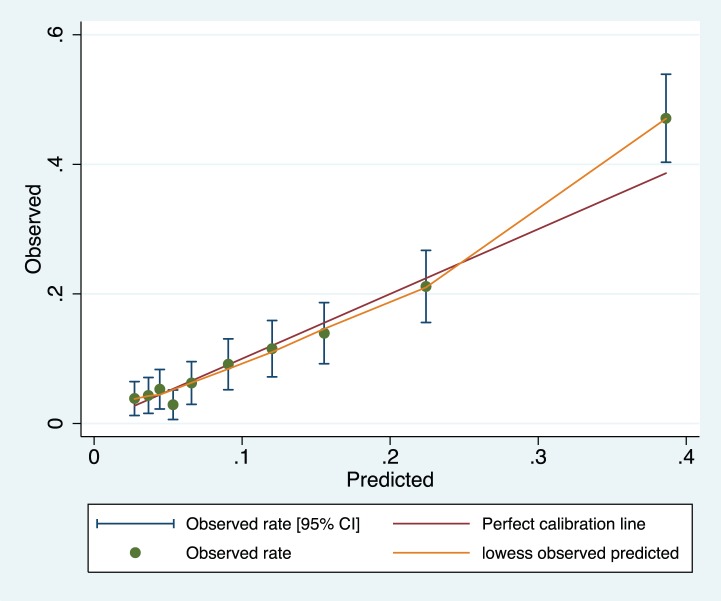
Figure 1. Calibration plot of the miniPIERS model applied 2,081 women in the cohort (H–L goodness of fit p = 0.1616).
Green line represents line of perfect fit between observed and predicted outcomes and orange line is a smoothed fit line between predicted probability and mean observed probability in each range.

