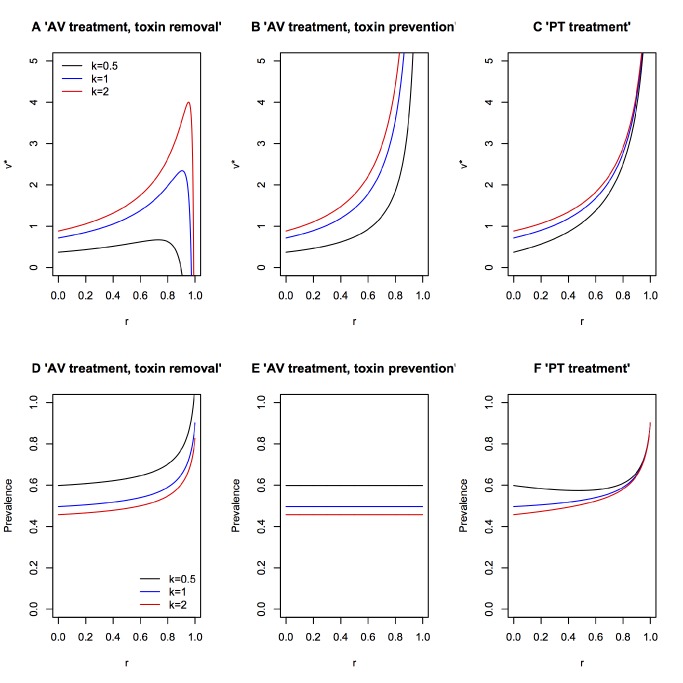
Figure 4. Epidemiological and evolutionary consequences of damage limitation treatments.
Evolutionarily stable virulence factor production v* (A–C) and prevalence (D–F), plotted against anti-virulence (AV) or pro-tolerance (PT) drug efficacy, r. We plot different levels of how virulence and transmission are related (k). Model details are described in Box 3. Parameter values are as in [56] b1 = 1, b2 = 0.5, d = 1, a = 0.2, σ = 0.1, c = 0.05. Varying the cost of virulence factor production c does not affect the overall trend of the results, although it does affect the magnitude v* and prevalence.

