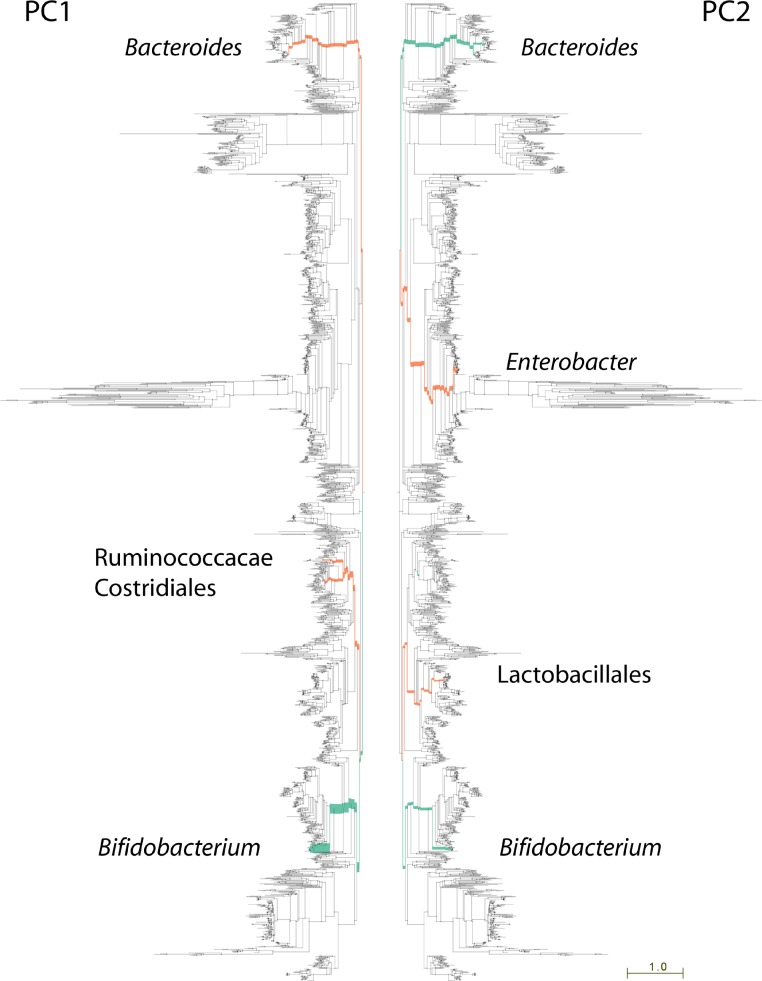
Figure 3. Lineages contributing variation in human fecal sample community structure.
106 metagenomic samples were processed using PhyloSift and their community composition compared using Edge PCA (Matsen & Evans, 2013). Lineages that decrease in abundance along the principal component axis are shown in turquoise color, those increasing in abundance are shown in red. Edge width is proportional to the change in abundance. Remaining lineages in the phylogeny of bacteria, archaea, eukarya, and some viruses are shown in light gray. PC1 shown at left, PC2 at right.

