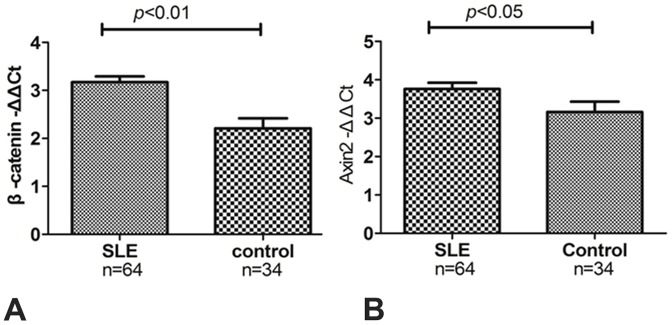
Figure 2. The mRNA expression of β-catenin and Axin2 in LN and control kidney tissues.

The mRNA expression of β-catenin in LN patients was significantly greater compared with controls (-ΔΔCt = 3.171±0.122 vs. 2.208±0.201, respectively, p<0.01) (A). mRNA expression of Axin2 in LN patients was significantly greater compared with controls (-ΔΔCt = 3.762±0.160 vs. 3.160±0.271, p<0.05,) (B).
