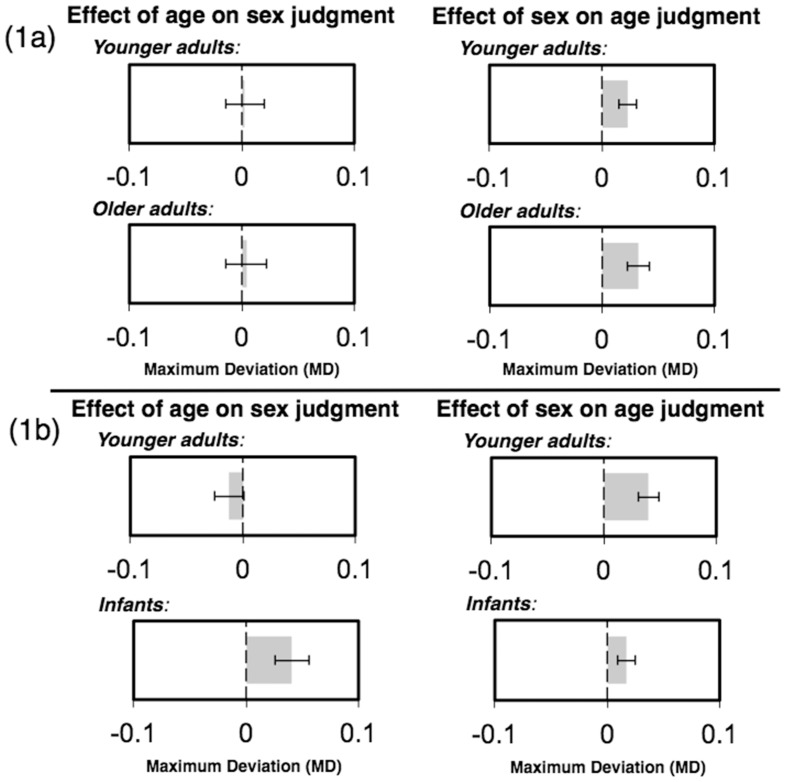
Figure 3. Top: Graphical display of the maximum deviation scores (MD) when categorizing older adults and younger adults faces as a functions of either their sex (left) or their age (right).
Bottom: Graphical display of maximum deviation scores (MD) when categorizing infant and younger adults faces as a functions of either their sex (left) or their age (right).

