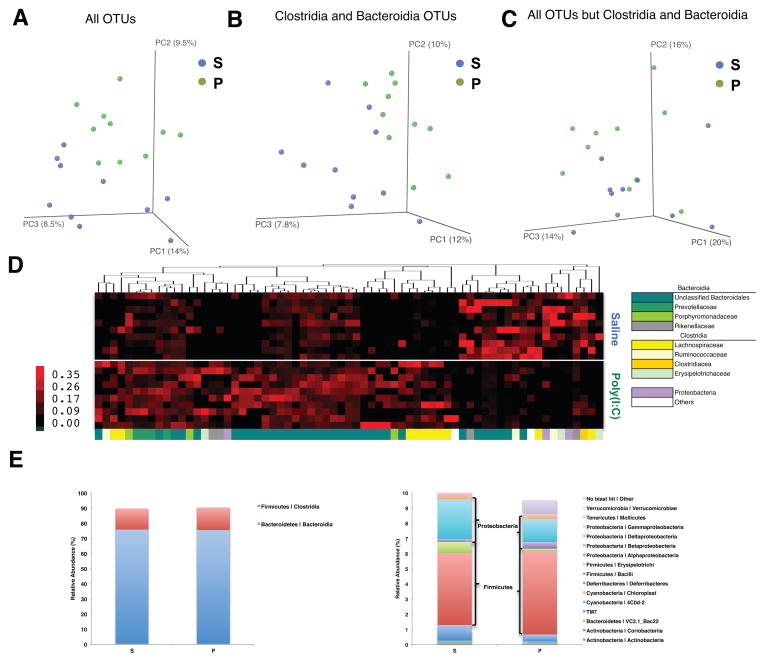
Figure 2. MIA Offspring Exhibit Dysbiosis of the Intestinal Microbiota.
(A) Unweighted UniFrac-based 3D PCoA plot based on all OTUs.
(B) Unweighted UniFrac-based 3D PCoA plot based on subsampling of Clostridia and Bacteroidia OTUs (2003 reads per sample).
(C) Unweighted UniFrac-based 3D PCoA plot based on subsampling of OTUs remaining after subtraction of Clostridia and Bacteroidia OTUs (47 reads per sample).
(D) Relative abundance of unique OTUs of the gut microbiota (bottom, x-axis) for individual biological replicates (right, y-axis), where red huesde note increasing relative abundance of a unique OTU.
(E) Mean relative abundance of OTUs classified at the class level for the most (left) and least (right) abundant taxa.
n=10/group. Data were simultaneously collected and analyzed for poly(I:C)+B. fragilis treatment group (See Figure 4). See also Figure S2 and Table S1.

