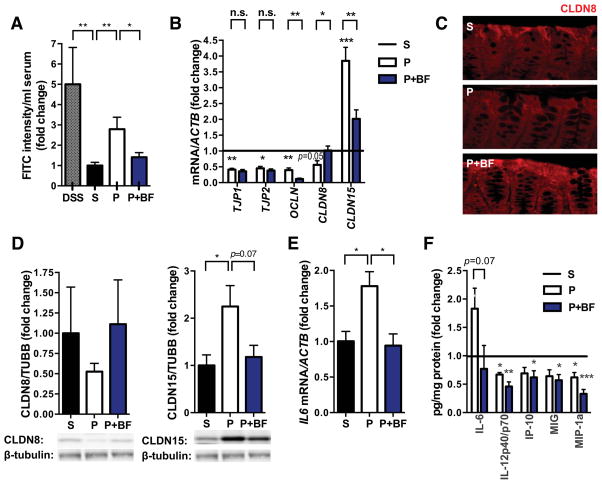
Figure 3. B. fragilis Treatment Corrects GI Deficits in MIA offspring.
(A) Intestinal permeability assay, measuring FITC intensity in serum after oral gavage of FITC-dextran. Data are normalized to saline controls. Data for DSS, saline (S) and poly(I:C) (P) are as in Figure 1. poly(I:C)+B. fragilis (P+BF): n=9/group
(B) Colon expression of tight junction components relative to β-actin. Data for each gene are normalized saline controls. Data for S and P are as in Figure 1. Asterisks directly above bars indicate significance compared to saline control (normalized to 1, as denoted by the black line), whereas asterisks at the top of the graph denote statistical significance between P and P+BF groups. n=8/group
(C) Immunofluorescence staining for claudin 8. Representative images for n=5.
(D) Colon protein levels of claudin 8 (left) and claudin 15 (right). Representative signals are depicted below. Data are normalized to signal intensity in saline controls. n=3/group
(E) Colon expression of IL-6 relative to β-actin. Data are normalized to saline controls. Data for S and P are as in Figure 1. P+BF: n=3/group
(F) Colon protein levels of cytokines and chemokines relative to total protein content. Data are normalized to saline controls. Data for S and P are as in Figure 1. n=10/group
See also Figure S1.

