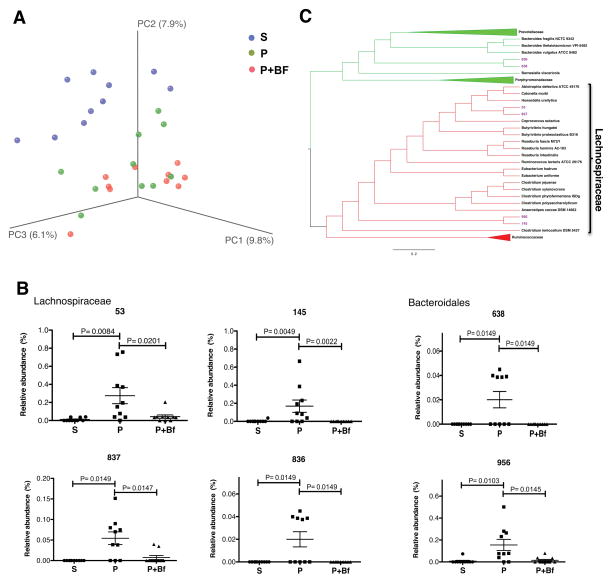
Figure 4. B. fragilis Treatment Alters the Intestinal Microbiota and Corrects Species-Level Abnormalities in MIA Offspring.
(A) Unweighted UniFrac-based 3D PCoA plot based on all OTUs. Data for saline (S) and poly(I:C) (P) are as in Figure 2.
(B) Relative abundance of key OTUs of the family Lachnospiraceae (top) and order Bacteroidales (bottom) that are significantly altered by MIA and restored by B. fragilis treatment.
(C) Phylogenetic tree based on nearest-neighbor analysis of 16S rRNA gene sequences for key OTUs presented in panel B. Red clades indicate OTUs of the family Lachnospiraceae and green clades indicate OTUs of the order Bacteriodales. Purple taxa indicate OTUs that are significantly elevated in P and corrected by B. fragilis(BF) treatment.

