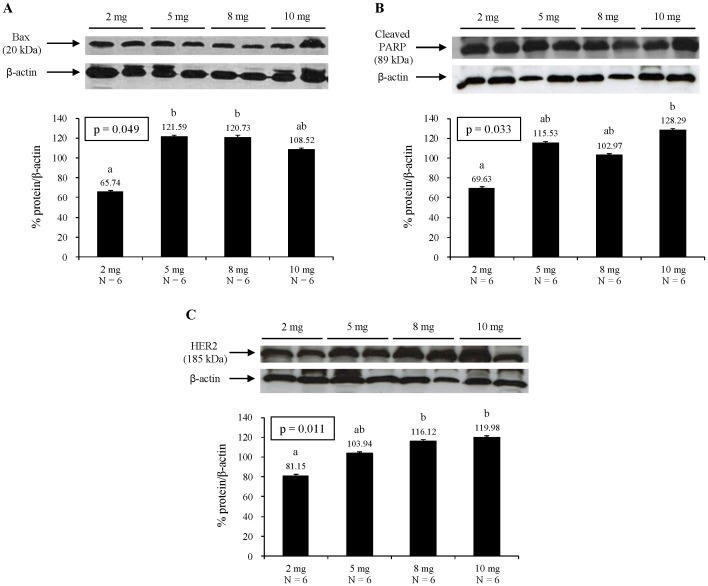
Figure 3. Effect of folic acid supplementation on Bax (A), PARP (B), and HER2 (C) protein expression.
Representative Western blot is presented on top and densitometric quantification of protein expression is presented as % protein/β actin at the bottom of each panel. Values are mean ± SEM. Different letters denote significant differences at p<0.05. All analyses were corrected for the effects of age at randomization and days on diet.

