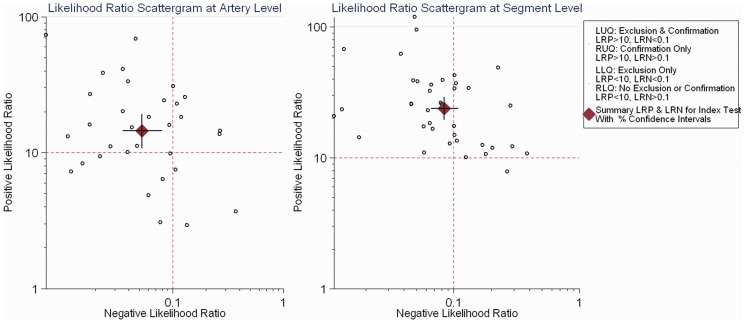
Figure 5. Illustration chart indicating the diagnostic role for accuracy of CTA at the artery and segment levels.
At the artery and segment levels, the likelihood ratio profile of CT was both an exclusion and s confirmation test to diagnose stenosis >50% (positive likelihood ratio >10; negative likelihood ratio <0.1), while CTA was generally a test of exclusion to rule out significant stenosis at the patient level (LRP = positive likelihood ratio, LRN = negative likelihood ratio, LLQ = left lower quadrant, LUQ = left upper quadrant, RLQ = right lower quadrant, RUQ = right upper quadrant).

