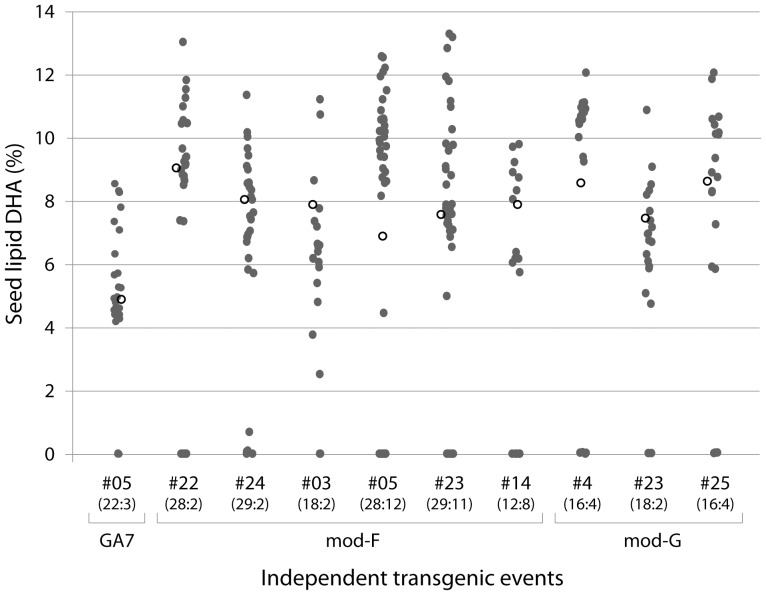
Figure 3. Relative level of DHA (as % of total fatty acids) in single seeds from independent T2 Camelina sativa events.
The transgenic to null ratio is shown in parenthesis under the event number (note that not all zero DHA seeds were null). Open circles denote the DHA level in a pooled batch of 20 seeds (analysed separately).

