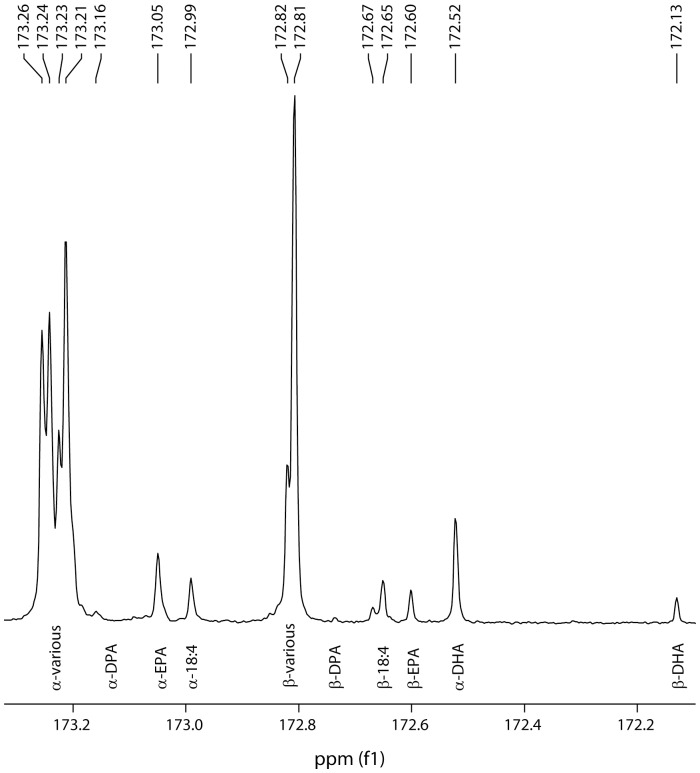
Figure 8. Trace of a 13C-NMR spectrum of the carbonyl (C1) region showing the positional distribution of EPA and DHA in transgenic Camelina sativa TAG with the sn-1,3 positions indicated by α and sn-2 by β.
Both EPA and DHA are preferentially located at sn-1,3, although the effect is weaker for EPA.

