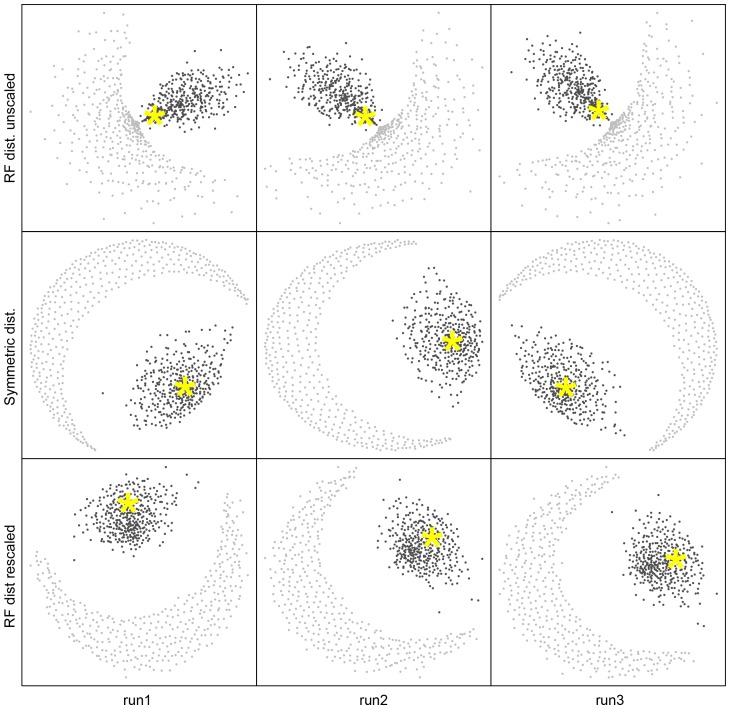
Figure 2. Non-metric multidimensional scaling (NMMDS) plots, representing in two dimensions the distances between 760 treeclouds.
Black dots represent the 380 treeclouds resulting from MrBayes analyses of 379 single-protein alignments and the UP alignment. Grey dots are 380 randomized treeclouds produced by randomly reshuffling the tip labels of each MrBayes tree. Top row: NMMDS plots of the mean Robinson-Foulds (RF) branch-length tree distances between treeclouds. Middle: NMMDS plots of the mean symmetric topology (sym) differences between treeclouds. Bottom: NMMDS plots of the mean RF distance between treeclouds when each tree was rescaled to a total length of 1. The three columns are equivalent and represent three different NMMDS runs starting from three different random seeds. The star represents the treecloud of the UP dataset.

