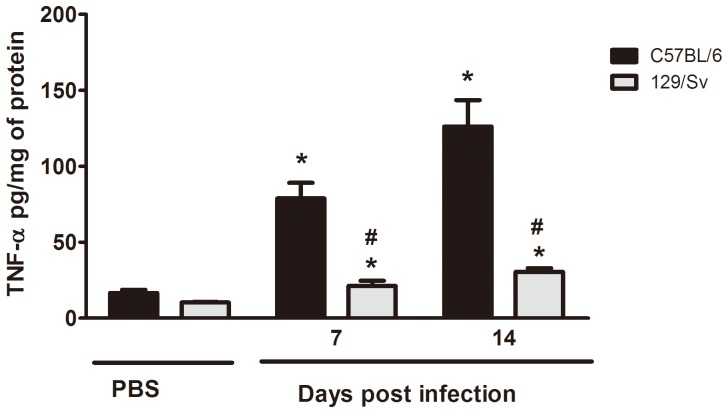
Figure 3. TNF-α production in lung of resistant (129/Sv) and susceptible (C57BL/6) mice.
Lungs were removed at 7 and 14 days after i.t. injection of PBS or 5×10⁵ H. capsulatum yeast cells. TNF-α levels were determinate by ELISA. Data are presented as the mean ± SEM and are representative from one of two independent experiments (n = 6/each experiment). * 129/Sv compared with C57BL/6; #129/Sv H. capsulatum compared with C57BL/6 H. capsulatum. p<0.05 vs. PBS.

