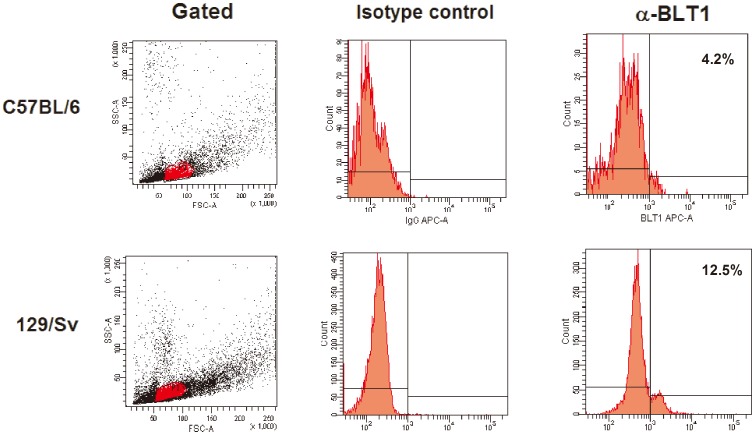
Figure 7. BLT1 expression on C57BL/6 (A) and 129/Sv (B) macrophages.
The resident cells were obtained as described in the Material and Methods, and the expression of the higher affinity receptor for LTB4 was evaluated by flow cytometry. The mononuclear population was gated using the forward/side scatters and analyzed to determine the fluorescence intensity on the cells. The numbers in the histograms indicate the percentage of cells expressing the BLT1 receptor. The results shown are from one experiment and are representative of two independent experiments.

