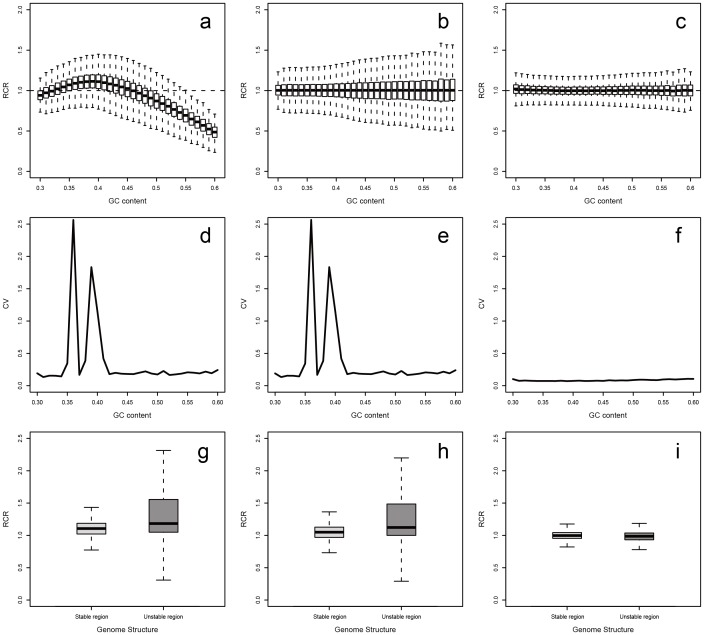
Figure 2. RCR distribution in correction process.
These plots represent the correction effects of the two-step correction methods in an observed sample (CS-NA18632). (a, b, c) Performance in the RCR distribution [original (a), after correction step-1 (b), after correction step-2 (c)]. (d, e, f) Performance in coefficient of variation changement [original (d), after correction step-1 (e), after correction step-2 (f)]. (g, h, i) Performance of the RCR correction effect in the regions that have the similar GC content (i.e. 38∼42%) but different genome structure (the left box is the stable regions, the right box is the regions that close to centromeres, telomeres or N regions) [original (g), after correction step-1 (h), after correction step-2 (i)].

