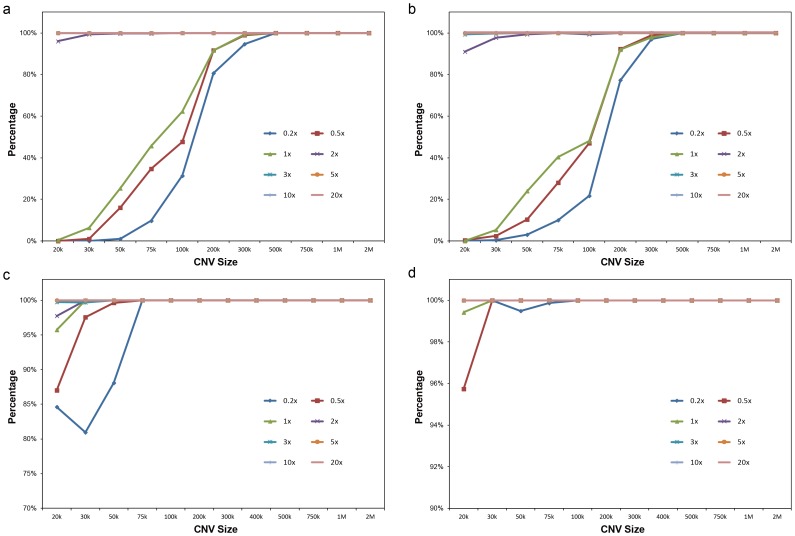
Figure 3. The sensitivity and specificity of PSCC in simulated CNVs detection process.
In these plots, X-axis stands for the CNV size ranged from 0.2 to 20×, and Y-axis was the percentage. The sequencing depth are color-coded and distinguished by characters. (a, b) Sensitivity of simulated CNV detection [Duplication (a), Deletion (b)]; (c, d) Specificity of simulated CNV detection [Duplication (c), Deletion (d)].

