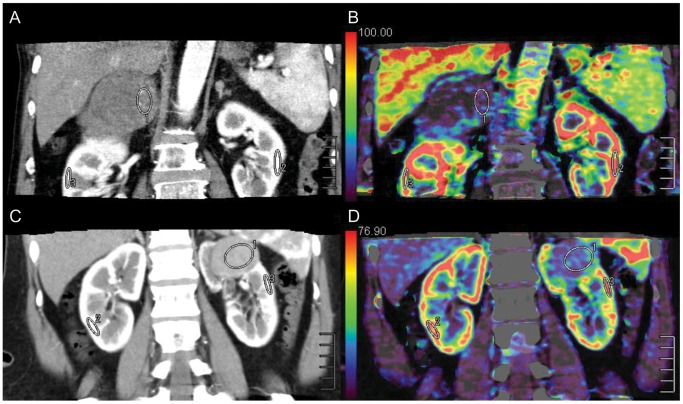
Figure 3. ROIs (ROI 1, ROI 2, and ROI 3) were drawn in the tumor and in healthy ipsi- and contralateral renal cortex.
ROI 1 was the ROI of tumor tissue. Papillary RCC (a) with the characteristics of hypo-vascularity (mean CT value = 67.4 HU) showed low perfusion values (mean Equiv BV = 14.1) (B), while chromophobe RCC (C) with a moderate blood supply (mean CT value = 85.0 HU) appeared low perfusion values (mean Equiv BV = 20.8) (D) too.

