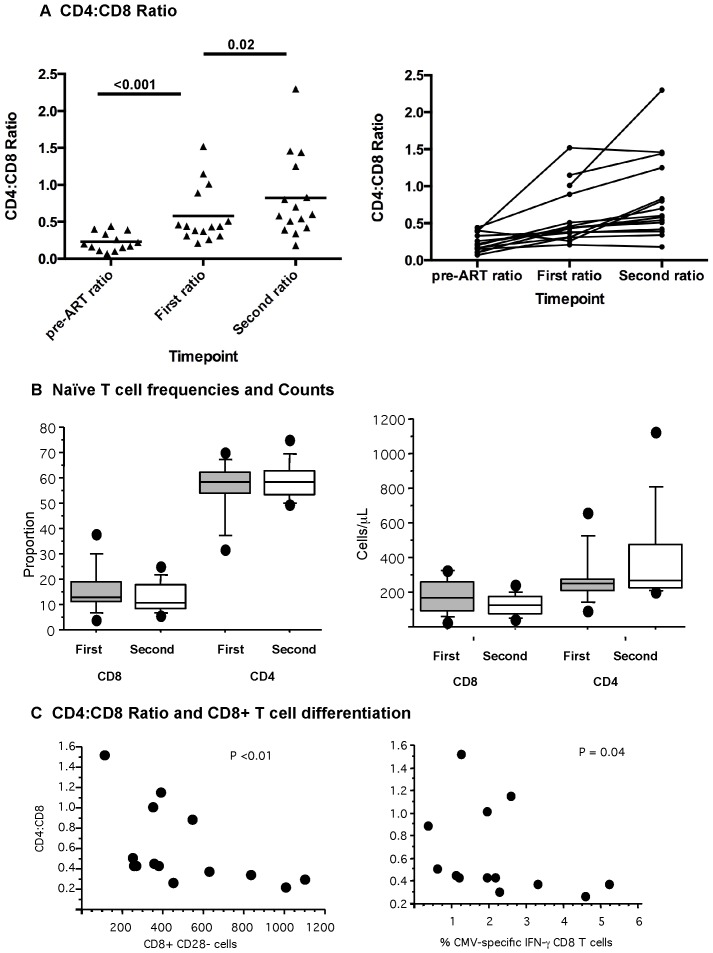
Figure 5. Longitudinal assessment of ART-suppressed subjects.
(A) CD4∶CD8 ratio in ART-suppressed Individuals at three timepoints (pre-ART, first timepoint on ART and second timepoint on ART). Subjects remained on antiretroviral therapy with suppressed viral load between “first” and “second” timepoint on ART. (B) Naïve subpopulations defined as CD27+CD28hiCCR7+CD45RA+. Proportion and absolute number/ml are depicted for the first and second timepoint. (C) CD4∶CD8 ratio in those suppressed on ART is shown in relationship to proportion of CD8+CD28− cells and also in relationship to the proportion of CMV-specific CD8+ T cells.

