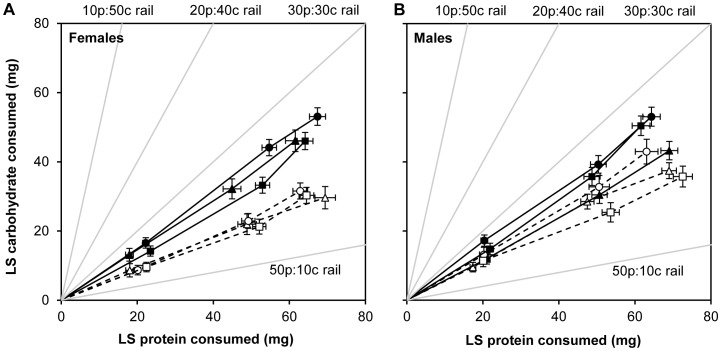
Figure 1. Bt resistance alters nutrient intake.
Bivariate least squares means (±SE) of protein and carbohydrate intake composed by (A) female and (B) male Bt-S (solid black symbols) and Bt-RU (open symbols). Points along each trajectory correspond to the cumulative intake of protein and carbohydrate over consecutive days. Intake points for day 0–1, days 0–2, and days 0-pupation are shown. The solid gray lines indicate the macronutrient ‘rails’ of each diet block provided. The choices were as follows: 50p:10c & 30p:30c (triangle); 50p:10c & 20p:40c (circle); 50p:10c & 10p:50c (square).

