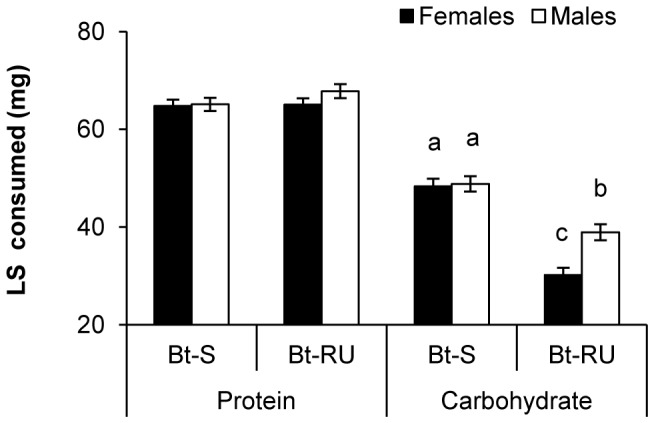
Figure 2. Sex differences in compensatory feeding.

Least squares means (±SE) of total protein and carbohydrate consumption for female and male Bt-S and Bt-RU. Different letters indicate significant differences from Tukey HSD comparison (p<0.05).

Least squares means (±SE) of total protein and carbohydrate consumption for female and male Bt-S and Bt-RU. Different letters indicate significant differences from Tukey HSD comparison (p<0.05).