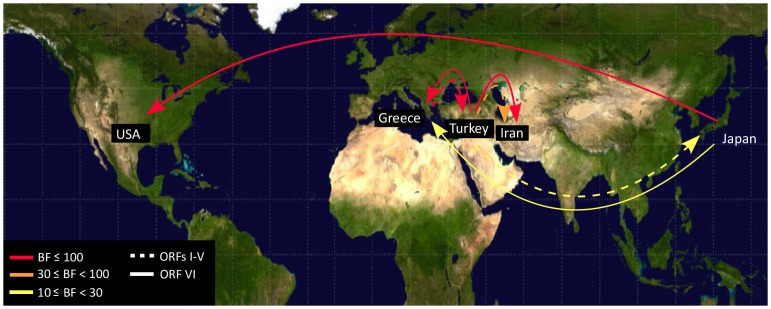
Figure 4. Patterns of Cauliflower mosaic virus migration jointly estimated across the two ORF regions.
ORFs I–V and ORF VI migrations are shown by solid and dashed lines. Lines connecting discrete regions indicate statistically supported ancestral state changes and their thicknesses denote statistical support. There are five categories of support. In increasing order, line thicknesses indicate 6≤BF<10 (positive support); 10≤BF<30 (strong support); 30≤BF<100 (very strong support); and BF≥100 (decisive support). Migration line was not shown when they were represented by only a single sample.

