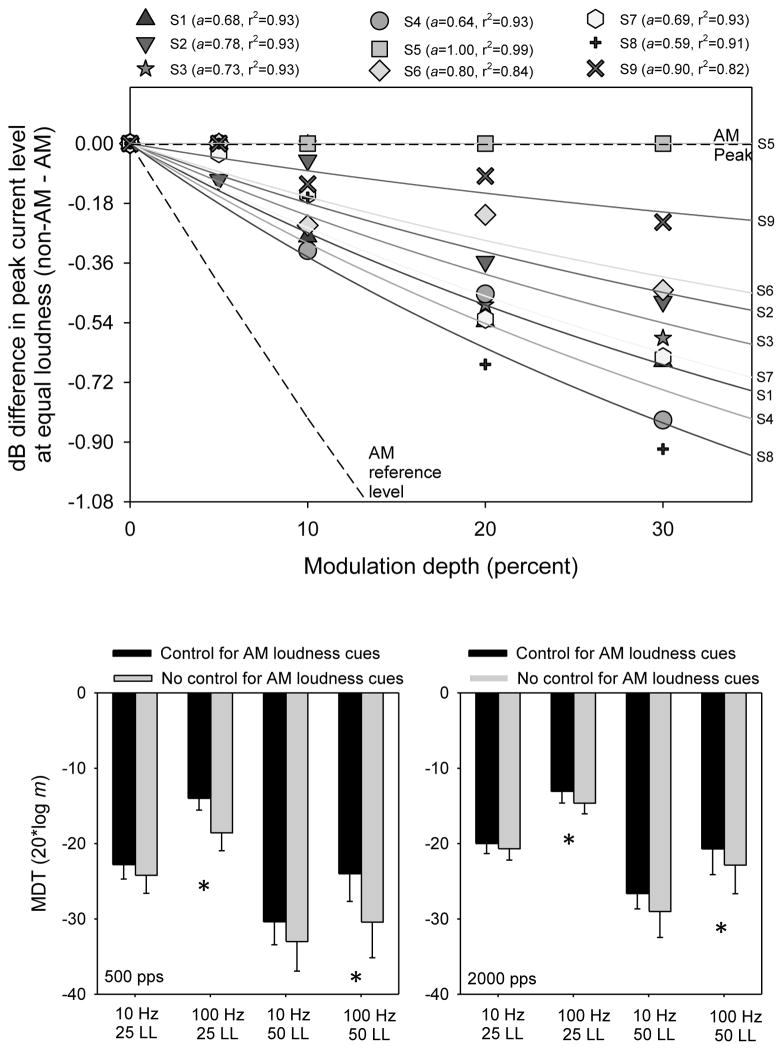
Fig. 1.
Top panel: Non-linear fits to loudness-balance data between AM and non-AM stimuli, as a function of modulation depth. Data were fit according to Eq. 1 (see Methods). The slope (a) and goodness of fit (r2) for the functions are listed next to individual subject symbols in the legend. The top dashed line shows the difference between AM and non-AM loudness in terms of average current level and the bottom dashed line shows the difference in terms of peak level. Each y-axis tic is equivalent to 1 clinical unit in the Nucleus CI device. Bottom left panel: Mean MDTs (across subjects) with the 500 pps stimulation rate, as a function of modulation frequency and stimulation level conditions. The black and gray bars show data with and without control for unwanted AM loudness cues, respectively. The asterisks show significant differences (paired t-tests, p<0.05). The error bars show the standard error. Bottom right panel: Same as bottom left panel, but for the 2000 pps stimulation rate.

