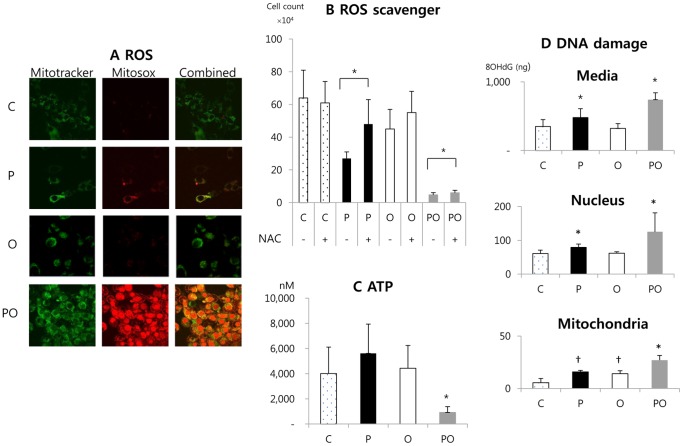
Figure 6. Effects of phenformin and oxamate on ROS, ATP levels, and DNA damage.
(A) CT26 cells were treated with compounds as indicated on the left. Eight hours after drug treatment MitoSOX staining was used to examine cellular levels of superoxide by confocal imaging. Mitotracker Green was used to label mitochondria. Magnification 100X. (B) CT26 cells were treated with the indicated compounds in the presence or absence of the ROS scavenger NAC (N-acetyl-cysteine). NAC was added to cultures 6 hours prior to adding phenformin or oxamate. Live cell number was then determined 24 hours after drug treatment. (C) Cells were treated with phenformin, oxamate, or both for 24 hours and then cellular ATP levels were measured. (D) Cells were treated as indicated for 24 hours and then the medium was collected and the cells fractionated into nuclear and mitochondria enriched fractions. In each compartment the level of oxidative damage to DNA was estimated using an ELISA to detect 8-OHdG. C: control, P: phenformin 1 mM, O: oxamate 40 mM, PO: phenformin 1 mM+oxamate 40 mM. *: P<0.05 compared with the other groups. †: P<0.05 compared with the group C and PO.

