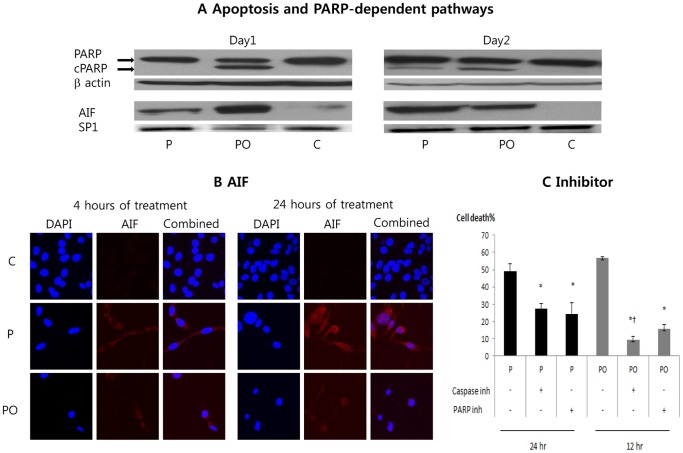
Figure 7. Cell death pathways induced by phenformin and oxamate.
(A) CT26 cells were treated as indicated at the bottom of each lane. Experiments were performed after either 1 day (left) or 2 days (right) of treatment. Western blot analysis of cPARP in total cell extracts was used as an estimate of apoptotic cell death. Western blot analysis of nuclear AIF was used as an estimate of PARP-dependent cell death. β-actin and SP1 were used for protein loading controls. (B) AIF (red) was detected by immunofluorescence in cells that had been treated with the compounds indicated on the left and for the time indicated at the top. DAPI was use to stain nuclei (blue). (C) Cells were treated with phenformin or phenformin plus oxamate in the presence or absence of either a pan-caspase inhibitor or a PARP inhibitor. The percentage of dead cells was determined 24 hours after treatment in the P group and 12 hours after treatment in the PO group. C: control, P: phenformin 1 mM, PO: phenformin 1 mM+oxamate 40 mM. *: p<0.05 compared with the control group. †: P<0.05 compared with PO+PARP inhibitor.

