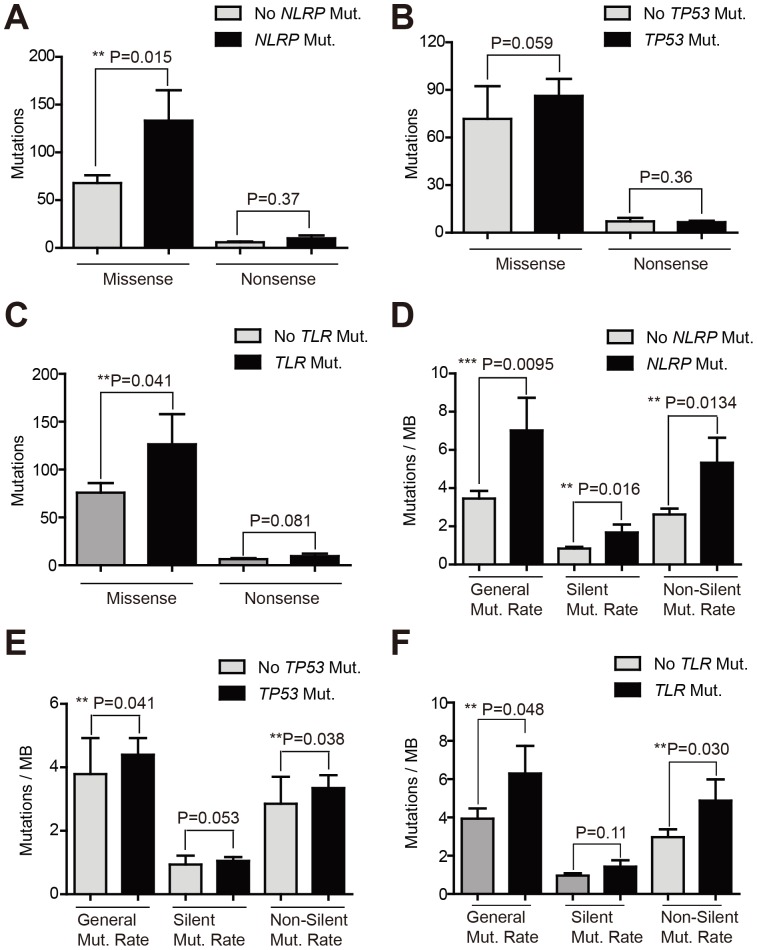
Figure 2. Mutation rates comparisons.
(A) Numbers of missense and nonsense mutations were compared between tumors with or without NLRP mutations. (B) Numbers of missense and nonsense mutations were compared between tumors with or without TP53 mutations. (C) Numbers of missense and nonsense mutations were compared between tumors with or without TLR genes mutations. (D) Mutation rates [shown as mutations per million base (MB) pairs] were compared between tumors with or without NLRP mutations. (E) Mutation rates [shown as mutations per million base (MB) pairs] were compared between tumors with or without TP53 mutations. (F) Mutation rates [shown as mutations per million base (MB) pairs] were compared between tumors with or without TLR genes mutations. P value less than 0.05 was considered significant.

