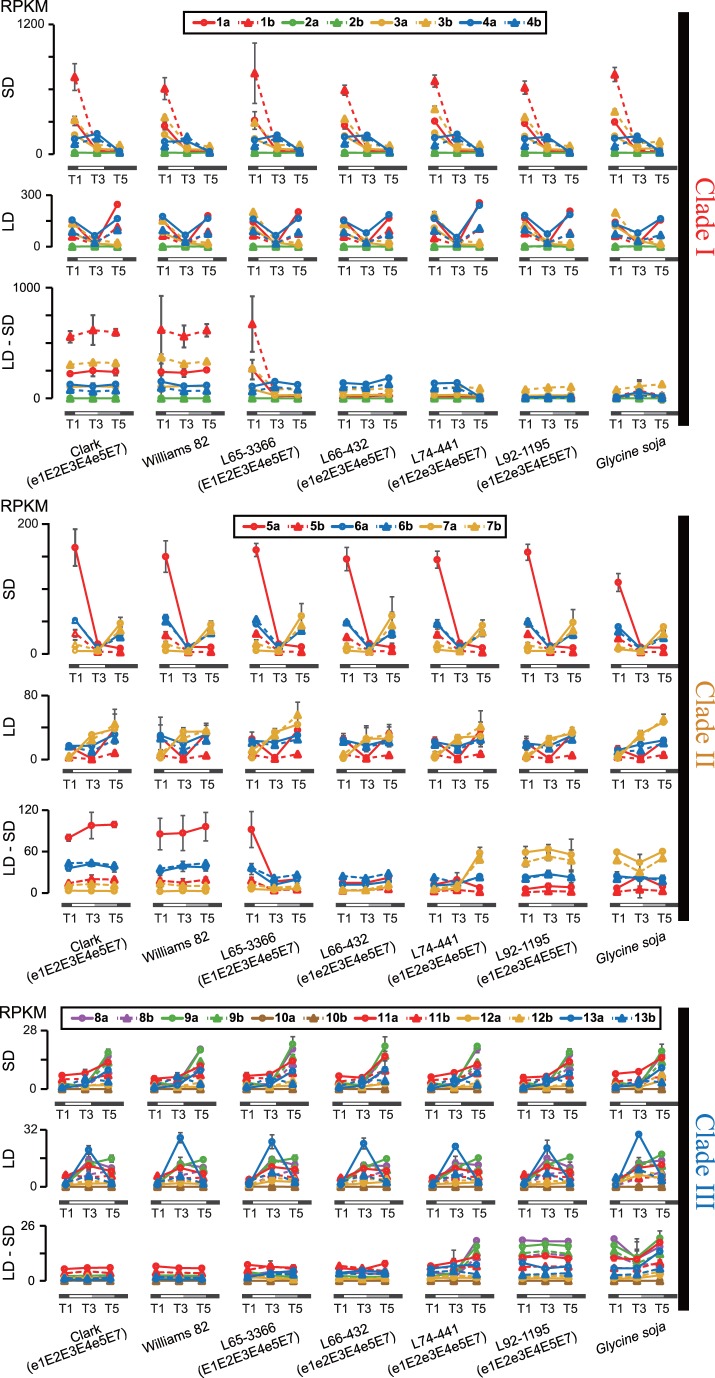
Figure 2. mRNA abundance of GmCOLs measured by RNA sequencing. RPKM values are displayed on the left.
The top panel shows GmCOLs in Clade I, the middle panel shows GmCOLs in Clade II, and the bottom panel shows GmCOLs in Clade III. SD is 10 hours light (6∶45–16∶45), LD is 16 hours light (6∶45–22∶45), and LD-SD is a shift from three weeks LD to 5 days SD. Samples are three representative time points: T1 (6∶30), T3 (14∶30) and T5 (22∶30).

