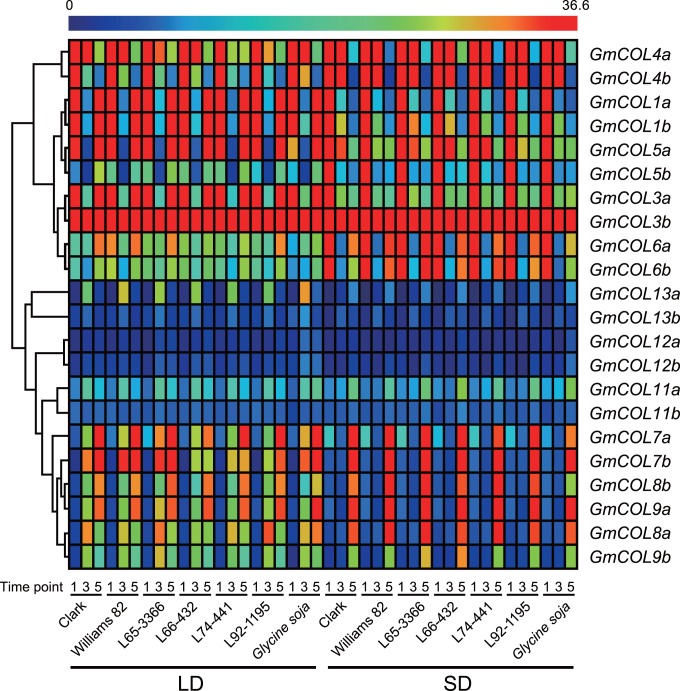
Figure 3. Hierarchical clustering of GmCOLs based on their mRNA abundance under LD and SD.
GmCOL2a, GmCOL2b, GmCOL10a and GmCOL10b are excluded due to their extreme low abundance. To demonstrate the variation in the mRNA abundance, a rainbow color scheme was used in which red indicates high expression and blue indicates low expression.

