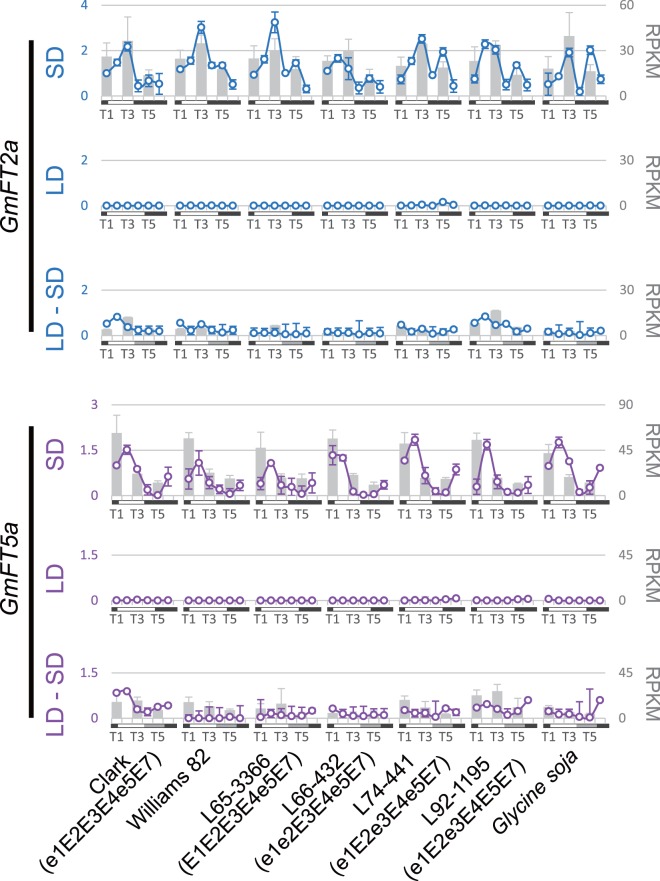
Figure 5. mRNA abundance of GmFT2a and GmFT5a.
Circles and solid lines represent the data obtained by qRT-PCR, and gray bars represent the data obtained by RNA sequencing. Relative expression levels of qRT-PCR among the samples in each panel are shown on the left, and RPKM values of RNA sequencing are shown on the right. SD is 10 hours light (6∶45–16∶45), LD is 16 hours light (6∶45–22∶45) and LD-SD is a shift from three weeks LD to 5 days SD. Time points T1–T6 represent 6∶30, 10∶30, 14∶30, 18∶30, 22∶30 and 2∶30. Note that RNA sequencing samples contain three representative time points: T1, T3 and T5.

