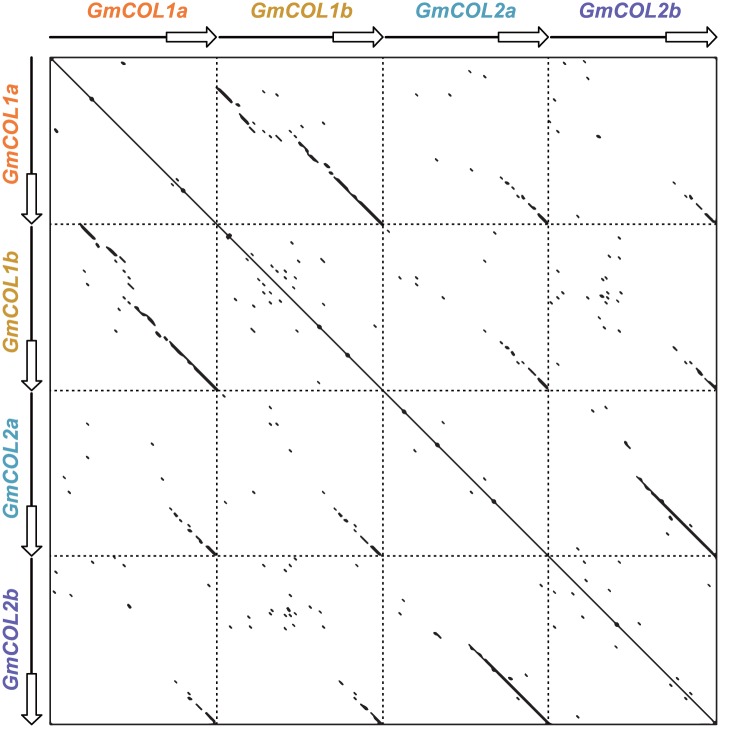
Figure 6. Comparison of the 2.5GmCOL1a, GmCOL1b, GmCOL2a and GmCOL2b.
Empty arrows indicate the coding sequence (introns were excluded); lines indicate the upstream intergenic region. Conserved sequences between two sequences are evident from the detected diagonal dotted lines. The dot plot was created using the Nucleic Acid Dot Plots program, with the following parameters: window size: 11; mismatch limit: 0.

