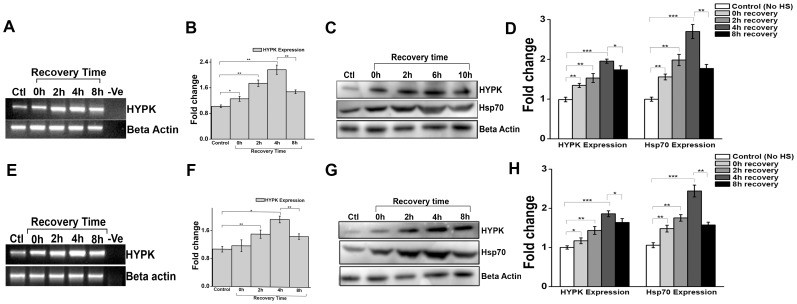
Figure 1. Heat shock induces HYPK expression in human (HeLa) and mouse (Neuro2A) cells.
A. Gel image representative of three (n = 3) independent experiments for sqRT-PCR of HYPK expression in HeLa cells undergoing no heat shock (HS) treatment (control), HeLa cells subjected to HS at 42°C for 60 min and no recovery (0 h), and HeLa cells subjected to HS as indicated followed by recovery at 37°C for 2, 4 and 8 hours (2, 4, 8 h). Expression of β-actin was taken as endogenous control. B. Bar graph showing the mean IOD of bands obtained in A. The expression level of HYPK in a sample was normalized by the corresponding β-actin expression level. Fold change was calculated by considering the relative expression level of HYPK in control HeLa cells to be 1. C. Western blot analysis for the expression of HYPK and Hsp70 in three independent experiments (n = 3) in HeLa cells undergoing no HS treatment (control) and other samples as indicated in A. Expression of β-actin was taken as loading control. D. Bar graph showing the mean IOD of bands obtained for HYPK and Hsp70 in C. The IOD of each HYPK and Hsp70 band was normalized by the corresponding β-actin band. Fold change was calculated taking the relative expression of HYPK and Hsp70 expression in control HeLa cells to be 1.E. gel image representative of three (n = 3) independent experiments for sqRT-PCR of HYPK expression in N2A cells undergoing no HS treatment (control), N2A cells subjected to HS at 42°C for 60 min and no recovery (0 h), and N2a cells subjected to HS as indicated followed by recovery at 37°C for 2, 4 and 8 hours (2, 4, 8 h). Expression of β-actin was taken as endogenous control. F. Bar graph showing the mean IOD of bands obtained in E. The expression level of HYPK in each sample was normalized by the corresponding β-actin expression level. Fold change was calculated by considering the relative expression level of HYPK in control N2A cells to be 1. G. Western blot analysis showing expression of HYPK and Hsp70 in three independent experiments (n = 3) in N2A cells undergoing no HS treatment (control) and other samples as indicated in E. Expression of β-actin was taken as loading control. H. Bar graph showing the mean IOD of bands obtained for HYPK and Hsp70 in G. The IOD of each HYPK and Hsp70 band was normalized by the corresponding β-actin band. Fold change was calculated taking the relative expression of HYPK and Hsp70 expression in control N2A cells to be 1. Error bars indicate ± SD. The statistical significance level between various experimental pairs is indicated (*,p<0.05; **,p<0.01; ***,p<0.001).

