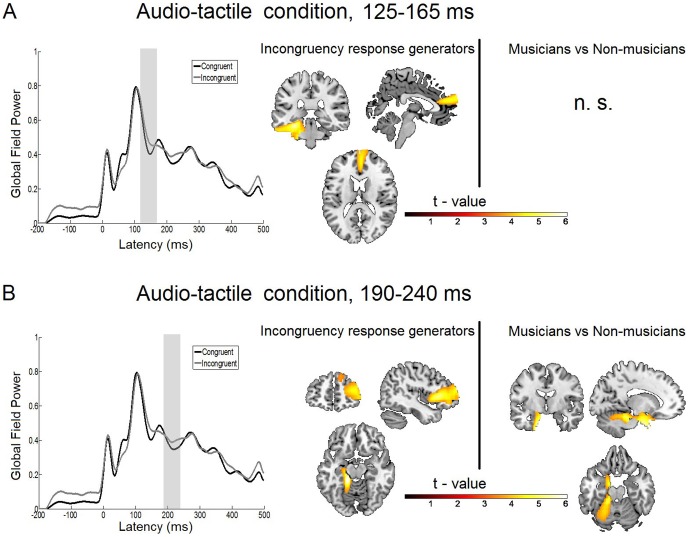
Figure 3. Statistical parametric maps and grand averaged global field power of the audio-tactile incongruency response.
A: Right: Statistical parametric maps of the audio-tactile incongruency response and the musicians versus non-musicians comparison as revealed by the flexible factorial model for the time window of 125 to 165 ms. Threshold: AlphaSim corrected at p<0.001 by taking into account peak voxel significance (threshold p<0.001 uncorrected) and cluster size (threshold size,>259 voxels). Left: Grand average global field power for standard (black line) and deviant (grey line) response. The gray bar indicates the time interval where the analysis was performed. B: Right: Statistical parametric maps of the audio-tactile incongruency response and the musicians versus non-musicians comparison as revealed by the flexible factorial model for the time window of 190 to 240 ms. Threshold: AlphaSim corrected at p<0.001 by taking into account peak voxel significance (threshold p<0.001 uncorrected) and cluster size (threshold size,>161 voxels). Left: Grand average global field power for standard (black line) and deviant (gray line) response. The gray bar indicates the time interval where the analysis was performed.

