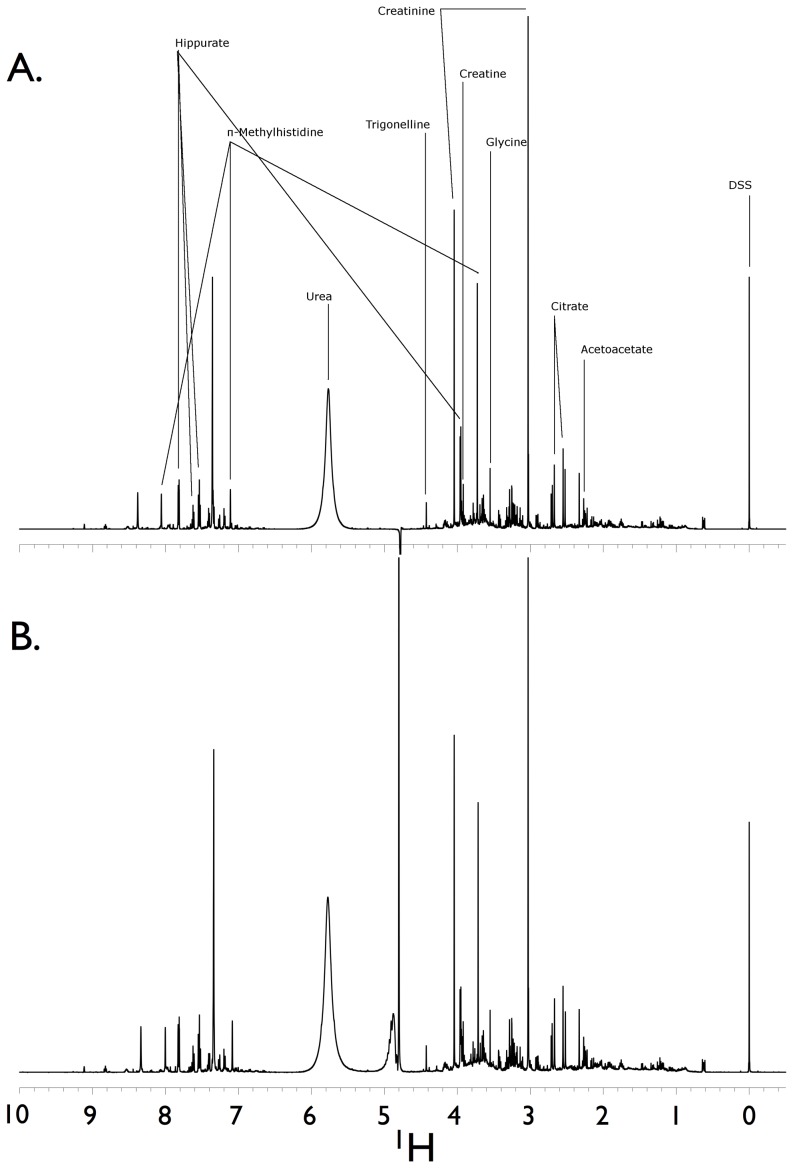
Figure 1. Hydrogen NMR spectra of two technical replicates of a single volunteer human urine sample.
Data were collected on two separate NMR spectrometers. The first replicate (A) was run on a Varian VNMRS 600 MHz spectrometer equipped with 5 mm HX probe and a 768AS (automatic sample handling) robotic system at the University of Alberta. The second replicate (B) was run on a Varian VNMRS 500 MHz equipped with a 5 mm “One-probe” with Z-axis pulsed field gradients and an Agilent/Varian 7510-AS sample handling system at the University of Michigan's Biochemical NMR Core Laboratory. The induced saturation power or γB1 (and calibrated excitation pulses) for the 600 and 500 MHz spectrometer data was 80 Hz (90° pulse) and 98 Hz (96° pulse was the default robotic setting), respectively. A representative number of named metabolites and their assigned spectral peaks are shown as well as the internal standard, DSS. DSS = 4,4-dimethyl-4-silapentane-1-sulfonic acid.

