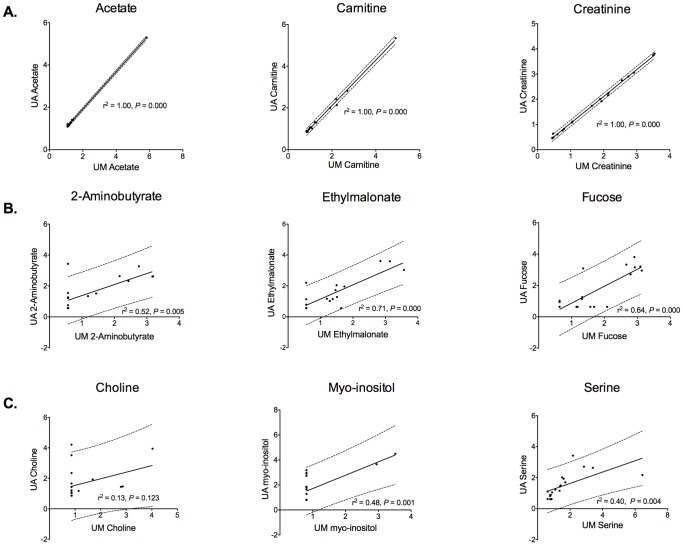
Figure 2. Representative Pearson linear regression plots with associated 95% prediction bands (dashed lines) of selected urine metabolites (normalized data).
These data show: (A) a high degree of correlation (r2 = 1.0), acetate, carnitine, and creatinine; (B) a moderate degree of correlation (r2≥0.5, <0.9), 2-aminobutyrate, ethylmalonate, and fucose; and (C) a low degree of correlation (r2<0.5), choline, myo-inositol, and serine. All data shown are from 1H-NMR spectra acquired from technical replicate samples using 5 mm probes at the University of Alberta (UA) and the University of Michigan (UM). In all cases, the correlation p value was significant with the exception of choline (p = 0.123).

