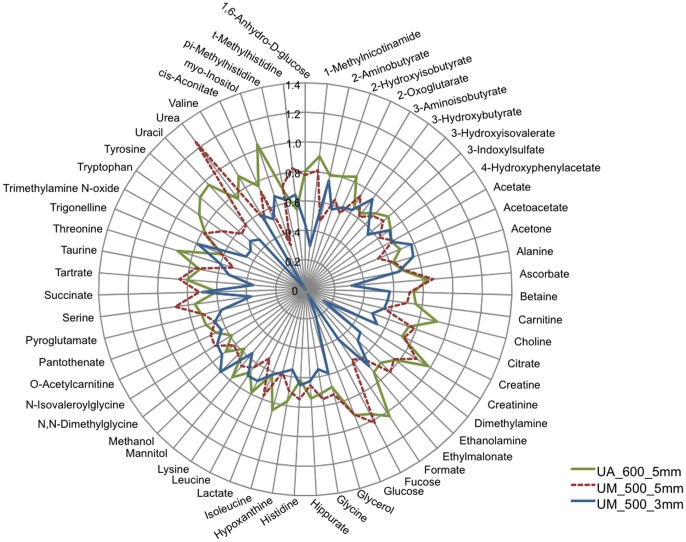
Figure 3. Radar plot of the normalized quantified 1H-NMR urine metabolites.
The plot permits the visualization of the similarities and discrepancies between the data generated using a 5(University of Alberta (UA), and University of Michigan (UM)), and a 3 mm probe (UM). The data are the mean of the normalized values for each metabolite. Overall, the results from the 5 mm probes are more similar to each other than those from the 3 mm probe (also see Fig. S2 and Fig. S3).

