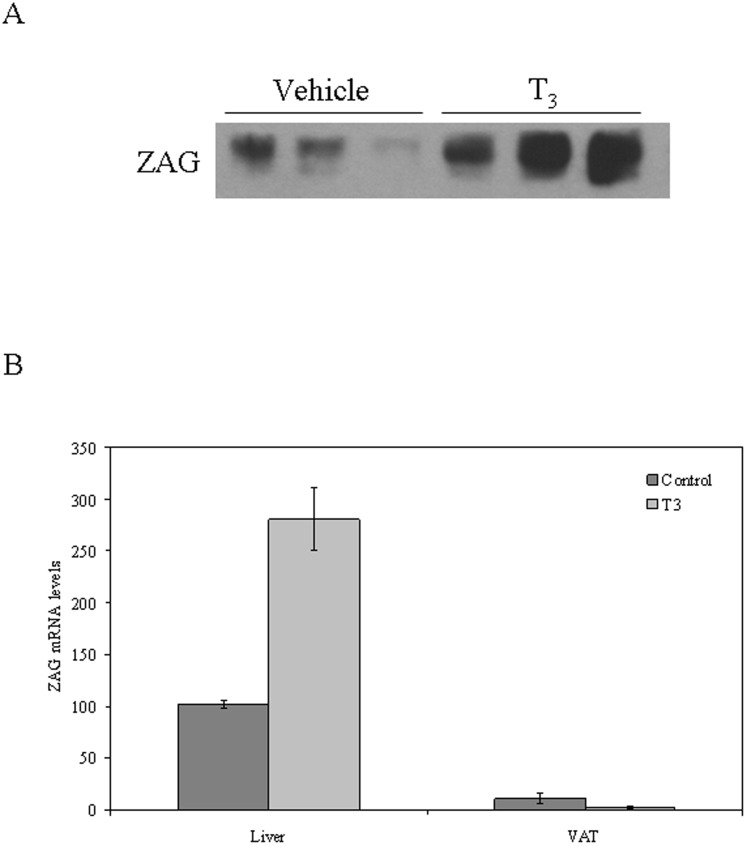
Figure 1. Treatment with T3 increases ZAG production by the liver but not in adipose tissue in C57BL/6 mice.
(A) ZAG blood levels increase in mice treated with T3 when compared with vehicle treated mice. (B) Analysis of ZAG mRNA expression in liver and adipose tissue of mice treated as in A. Mouse 18S was amplified as an internal control, and values are expressed as percentage relative to the untreated cells. Data are expressed as mean ± SD of triplicates.

